[1 / 1 / 1]
Quoted By:
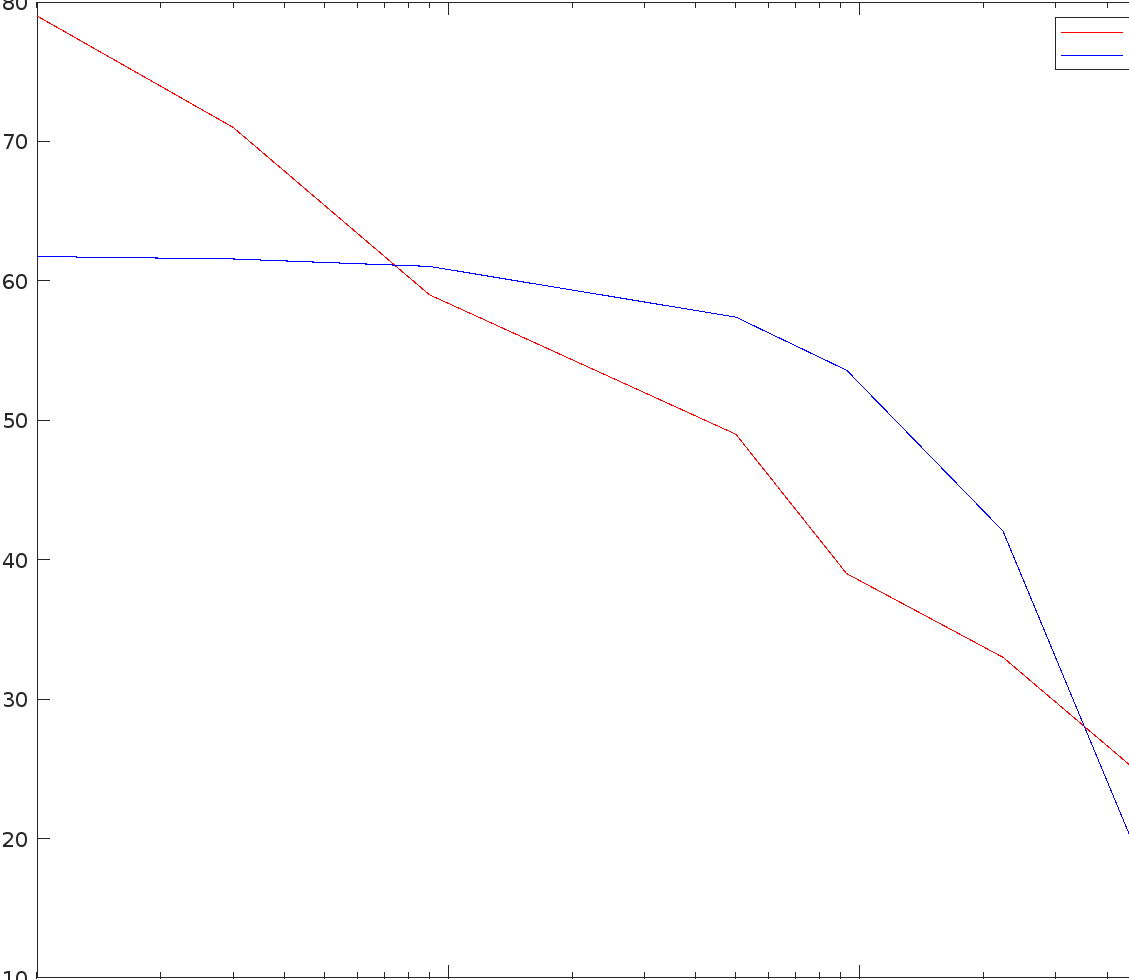
Need some homework help and I need it bad. Trying to do some linear regression but whatever the fuck I do I can't get the predicted output to have a linear form. The freq data is supposedly in a log10 scale so I'm thinking I've fucked up relative to that but I'm really lost on this. I also need to use the formulae I do so changing that is a no go. Picrel is my failed plot.
Red = given data
Blue = predicted/optimal data
clear
close all
clc
freq= [1000;3000;9000;50000;93000;223000;510000];
amp =[79;71;59;49;39;33;24];
Sxy = sum(freq .* amp);
Sx = sum(freq);
Sy = sum(amp);
SSxy = Sxy - (Sx*Sy) / length(freq);
Sx2 = sum(freq .^ 2);
SSxx = Sx2 - ((Sx^2) / length(freq));
a = SSxy / SSxx;
b = mean(amp) - a * mean(freq);
y_pred = a .* freq + b;
mare = (sum( abs(amp - y_pred) ./ amp) / length(freq)) * 100;
SSE = sum((amp - y_pred) .^ 2);
SST = sum((amp - mean(amp)) .^ 2);
r_sqr = 1 - (SSE/SST);
semilogx(freq,amp)
hold on
semilogx(freq,y_pred)
hold off
