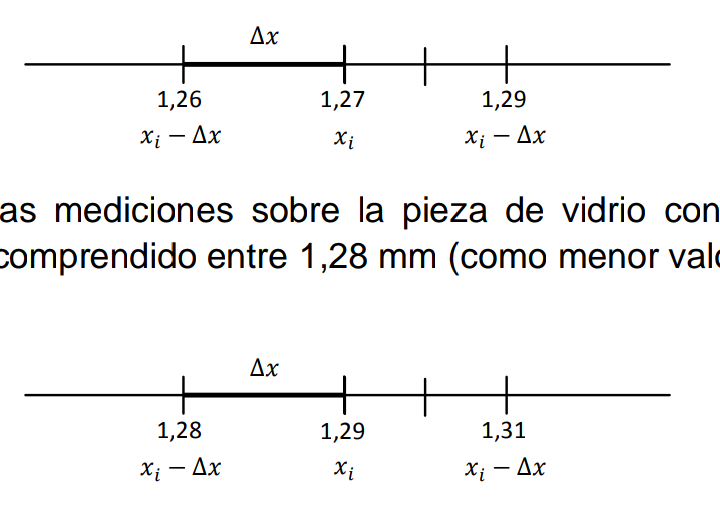
[1 / 1 / 1] 28KiB, 720x512, Screenshot_20240415-214812~2.png View SameGoogleImgOpsiqdbSauceNAO Thread Reply Original Report Media View Same Google ImgOps iqdb SauceNAO Download Anonymous Tue 16 Apr 2024 01:02:57 No.1456123 View ViewReplyOriginalReport Quoted By: What can I use to make a simple graph like this, with just the minimum, average and maximum values of a measure?